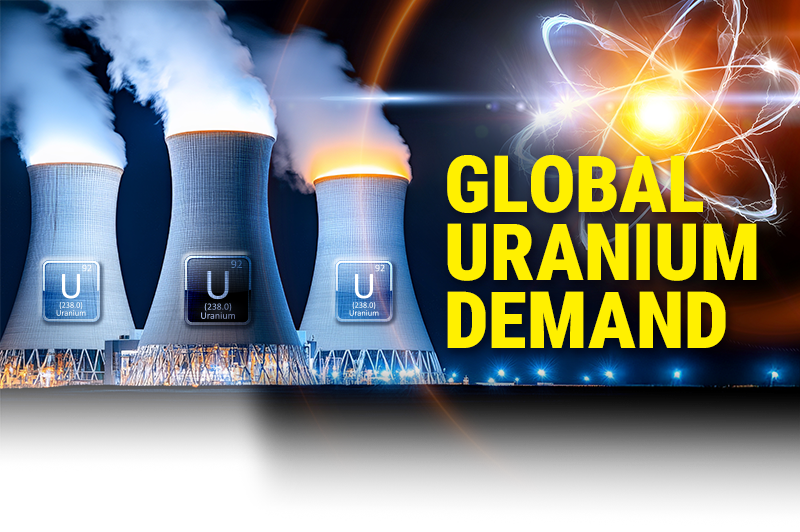
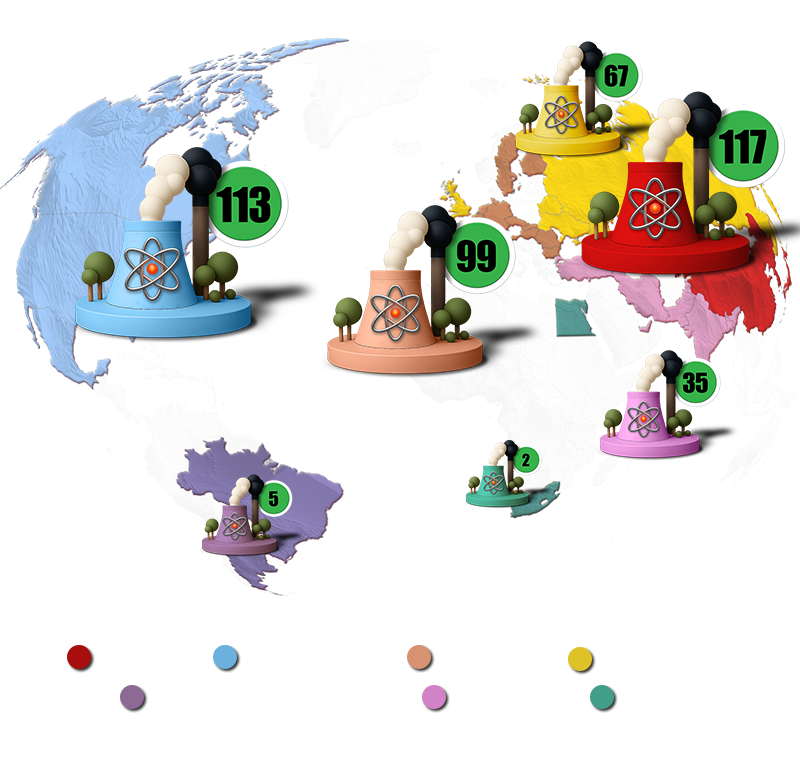
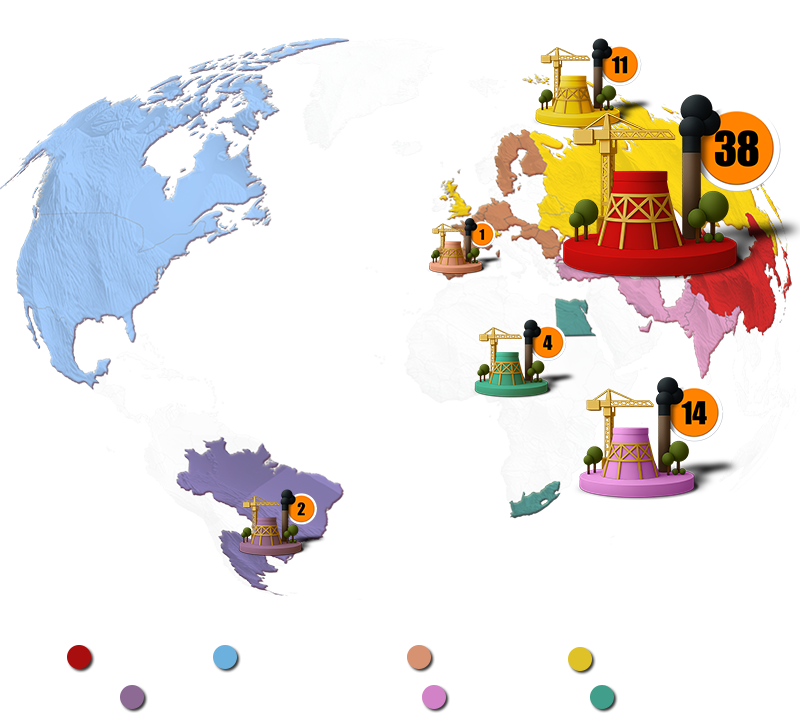
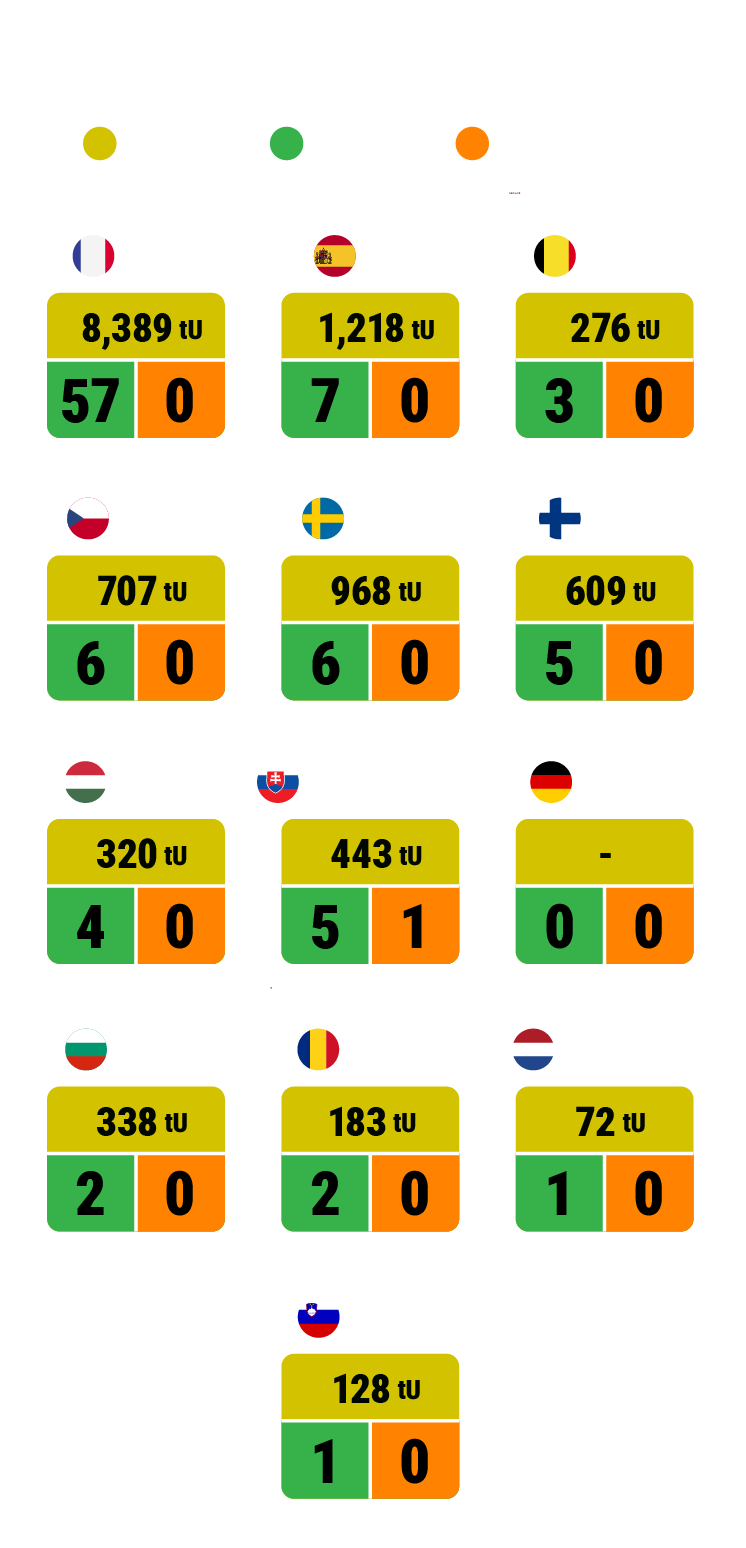
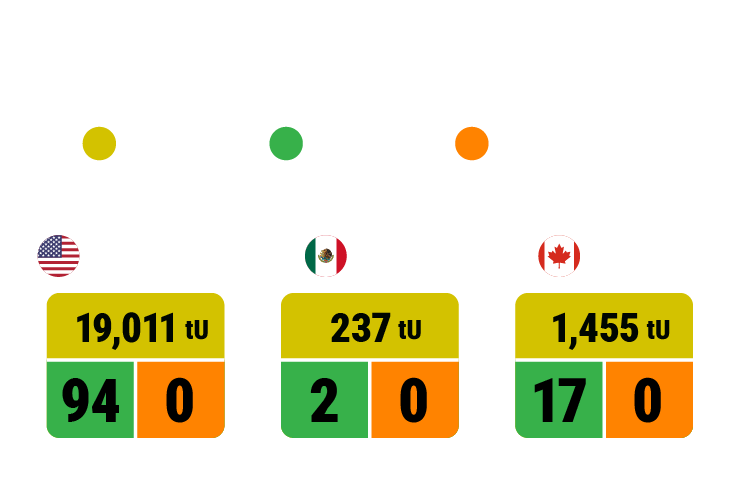
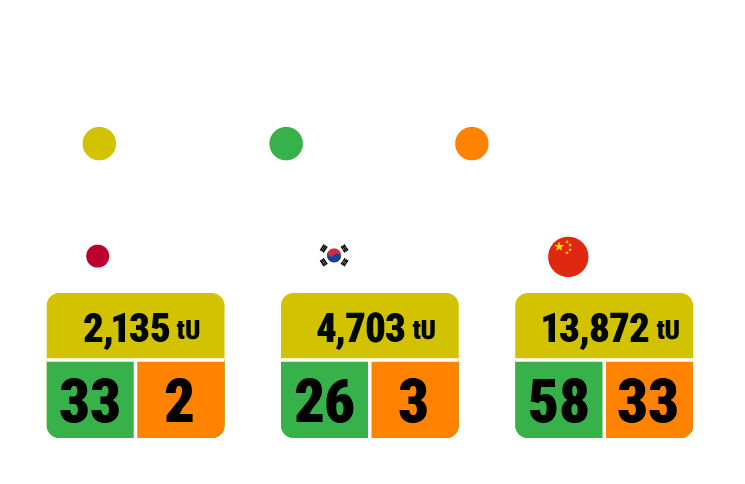
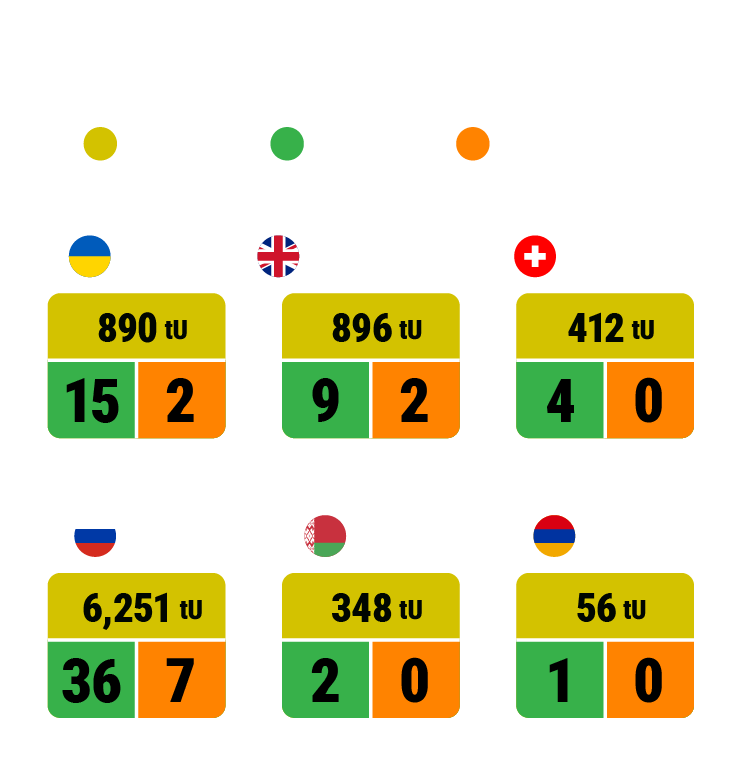
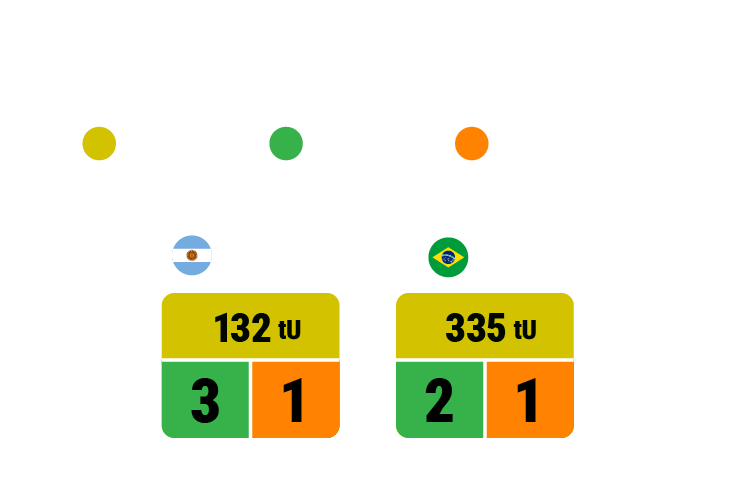
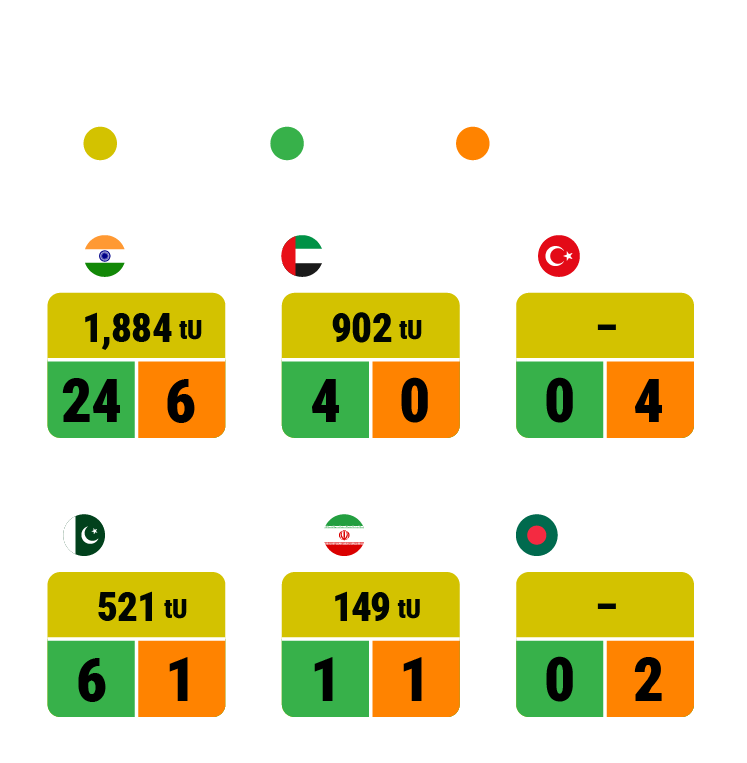
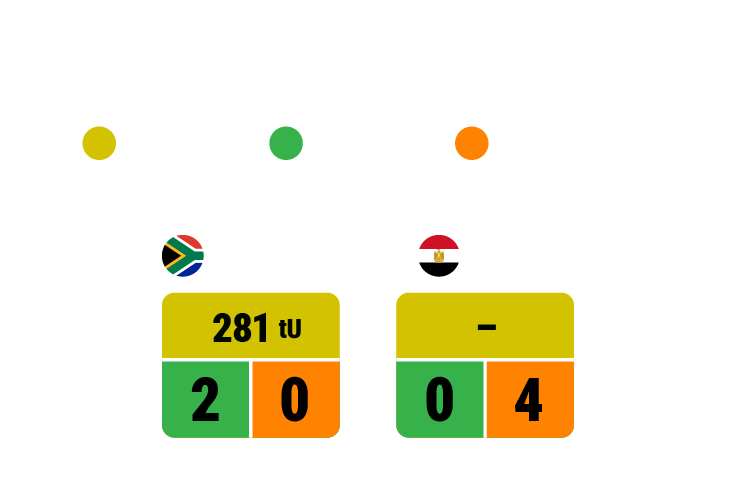
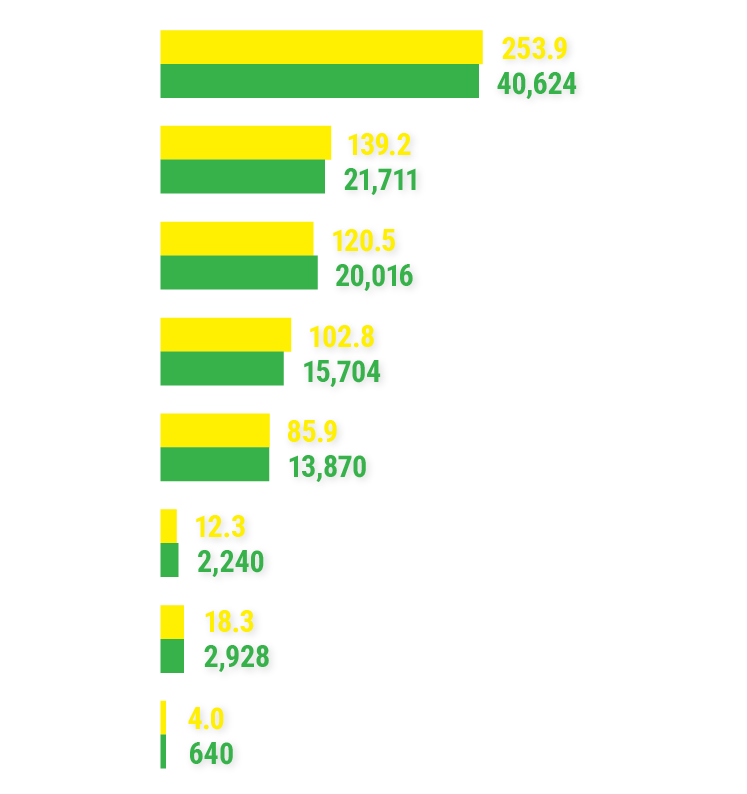
While nations need reliable, low-carbon energy to meet rising demand and reach climate goals, nuclear power is staging a powerful comeback. This infographic surveys the global nuclear energy landscape—identifying which regions host the most reactors in operation and under construction, and how much uranium is required to keep them running.
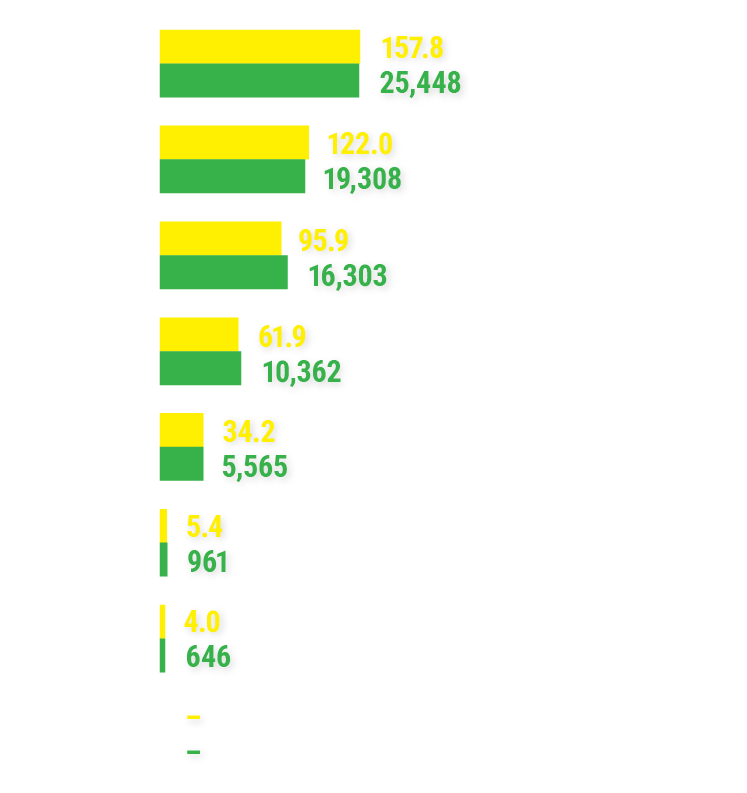
It then looks ahead 25 years, forecasting planned nuclear electricity generation capacity by region and the corresponding uranium demand—providing a clear picture of how the nuclear sector's resurgence will shape the world's energy mix and resource needs for decades to come.

Select Reactor Status

Choose region
Choose forecast year
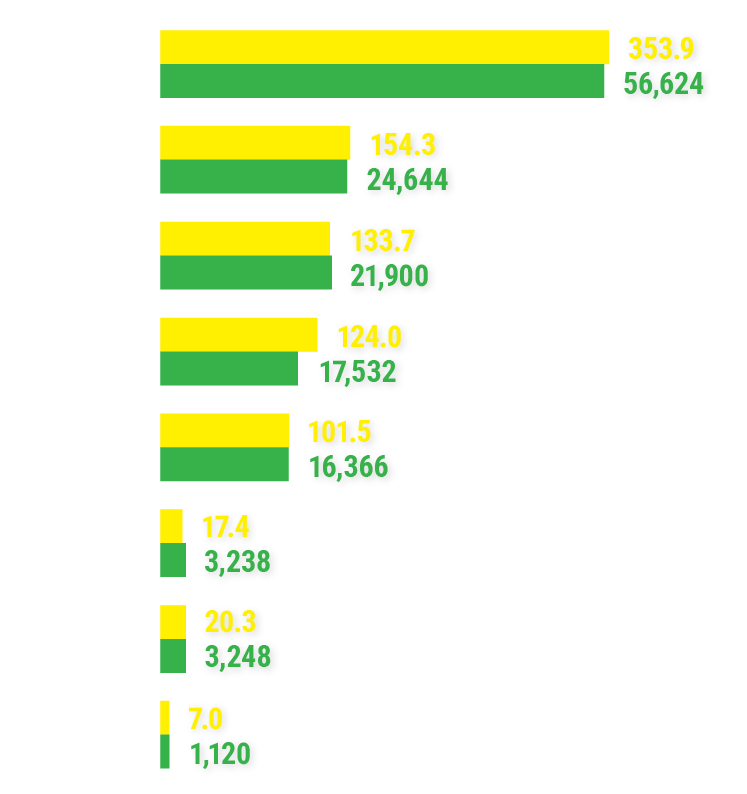
* This forecast includes an additional ≈ 10‐15 GWe (net) to account for the October 2025 U.S.‐Westinghouse Electric Company strategic partnership announcement. This range reflects the potential construction of 8‐10 AP1000 reactors, each generating about 1.15 GWe (net). The addition has been made to the forecast previously reported by the NEA and IAEA to reflect the impact of this recent project announcement.
Sources: Source: Nuclear Energy Agency and the International Atomic Energy Agency, Dall-E, Adobe Stock.
© 2025 mining.com & The Northern Miner.